So what is ProcDump?
I just thought I’d write a quick post showing you how to use the ProcDump utility, yet another great Sysinternals tool. This tool helps you capture unhandled exceptions in real-time from a running program.

Show me an example
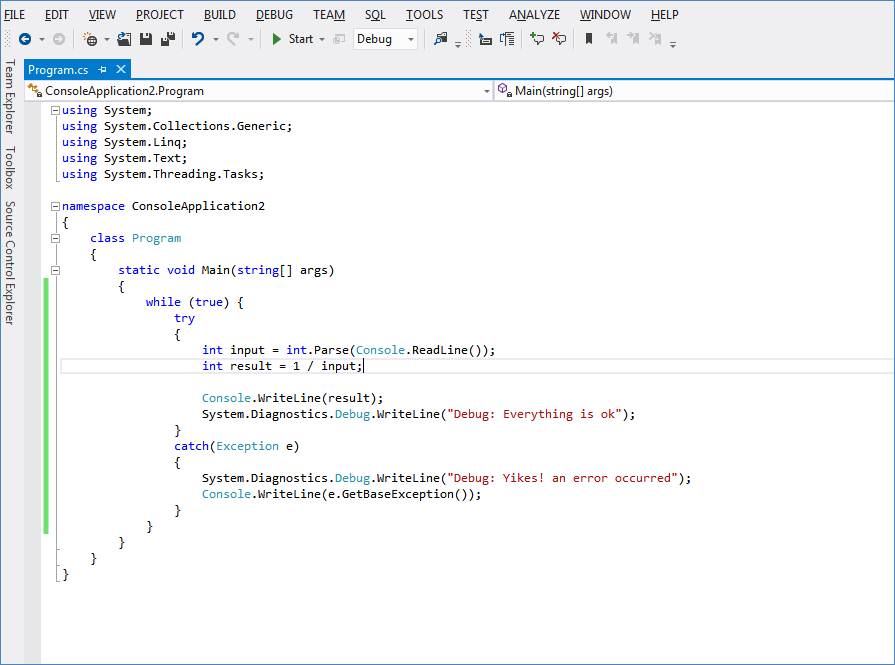
Just to demonstrate how it works, in the below example I created a simple Console application which divides ‘1’ by a user input value.
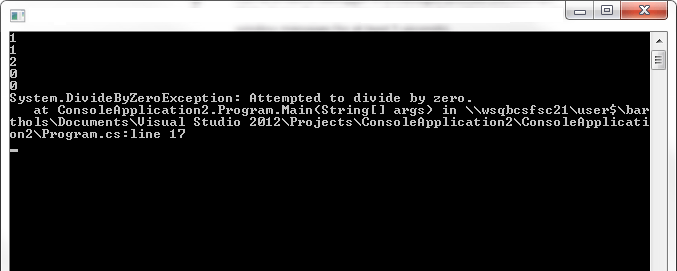
- First I launched the console application

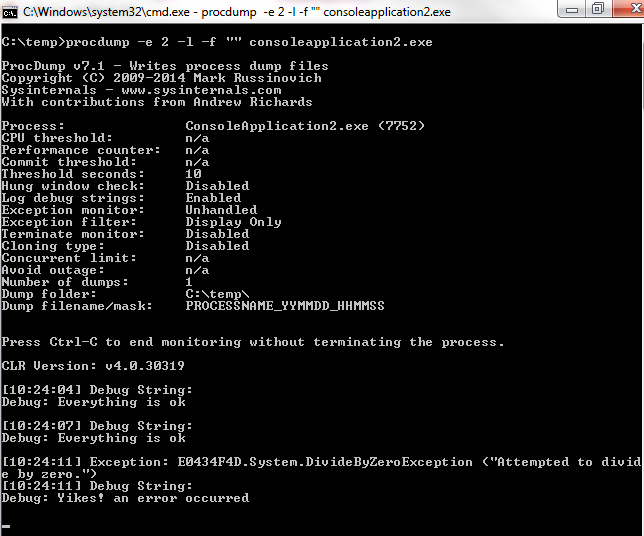
- Then I set a watch on the application through ProcDump by running command ‘procdump -e 2 -l -f “” consoleapplication2.exe‘. Note: In this case I’ve disabled the creation of a minidump file and enabled monitoring of debug output.

- Next, I entered some values into the console application and monitored the debug and exception output through ProcDump.

See, simple isn’t it 🙂
Latest posts by Shane Bartholomeusz (see all)
- Solved: Filename too long for Git - 18th April 2025
- GitHub Actions Exam Study Guide - 14th February 2025
- Solved: Build Errors Not Showing in VS 2022 - 21st November 2024


Reblogged this on IReadable.com.